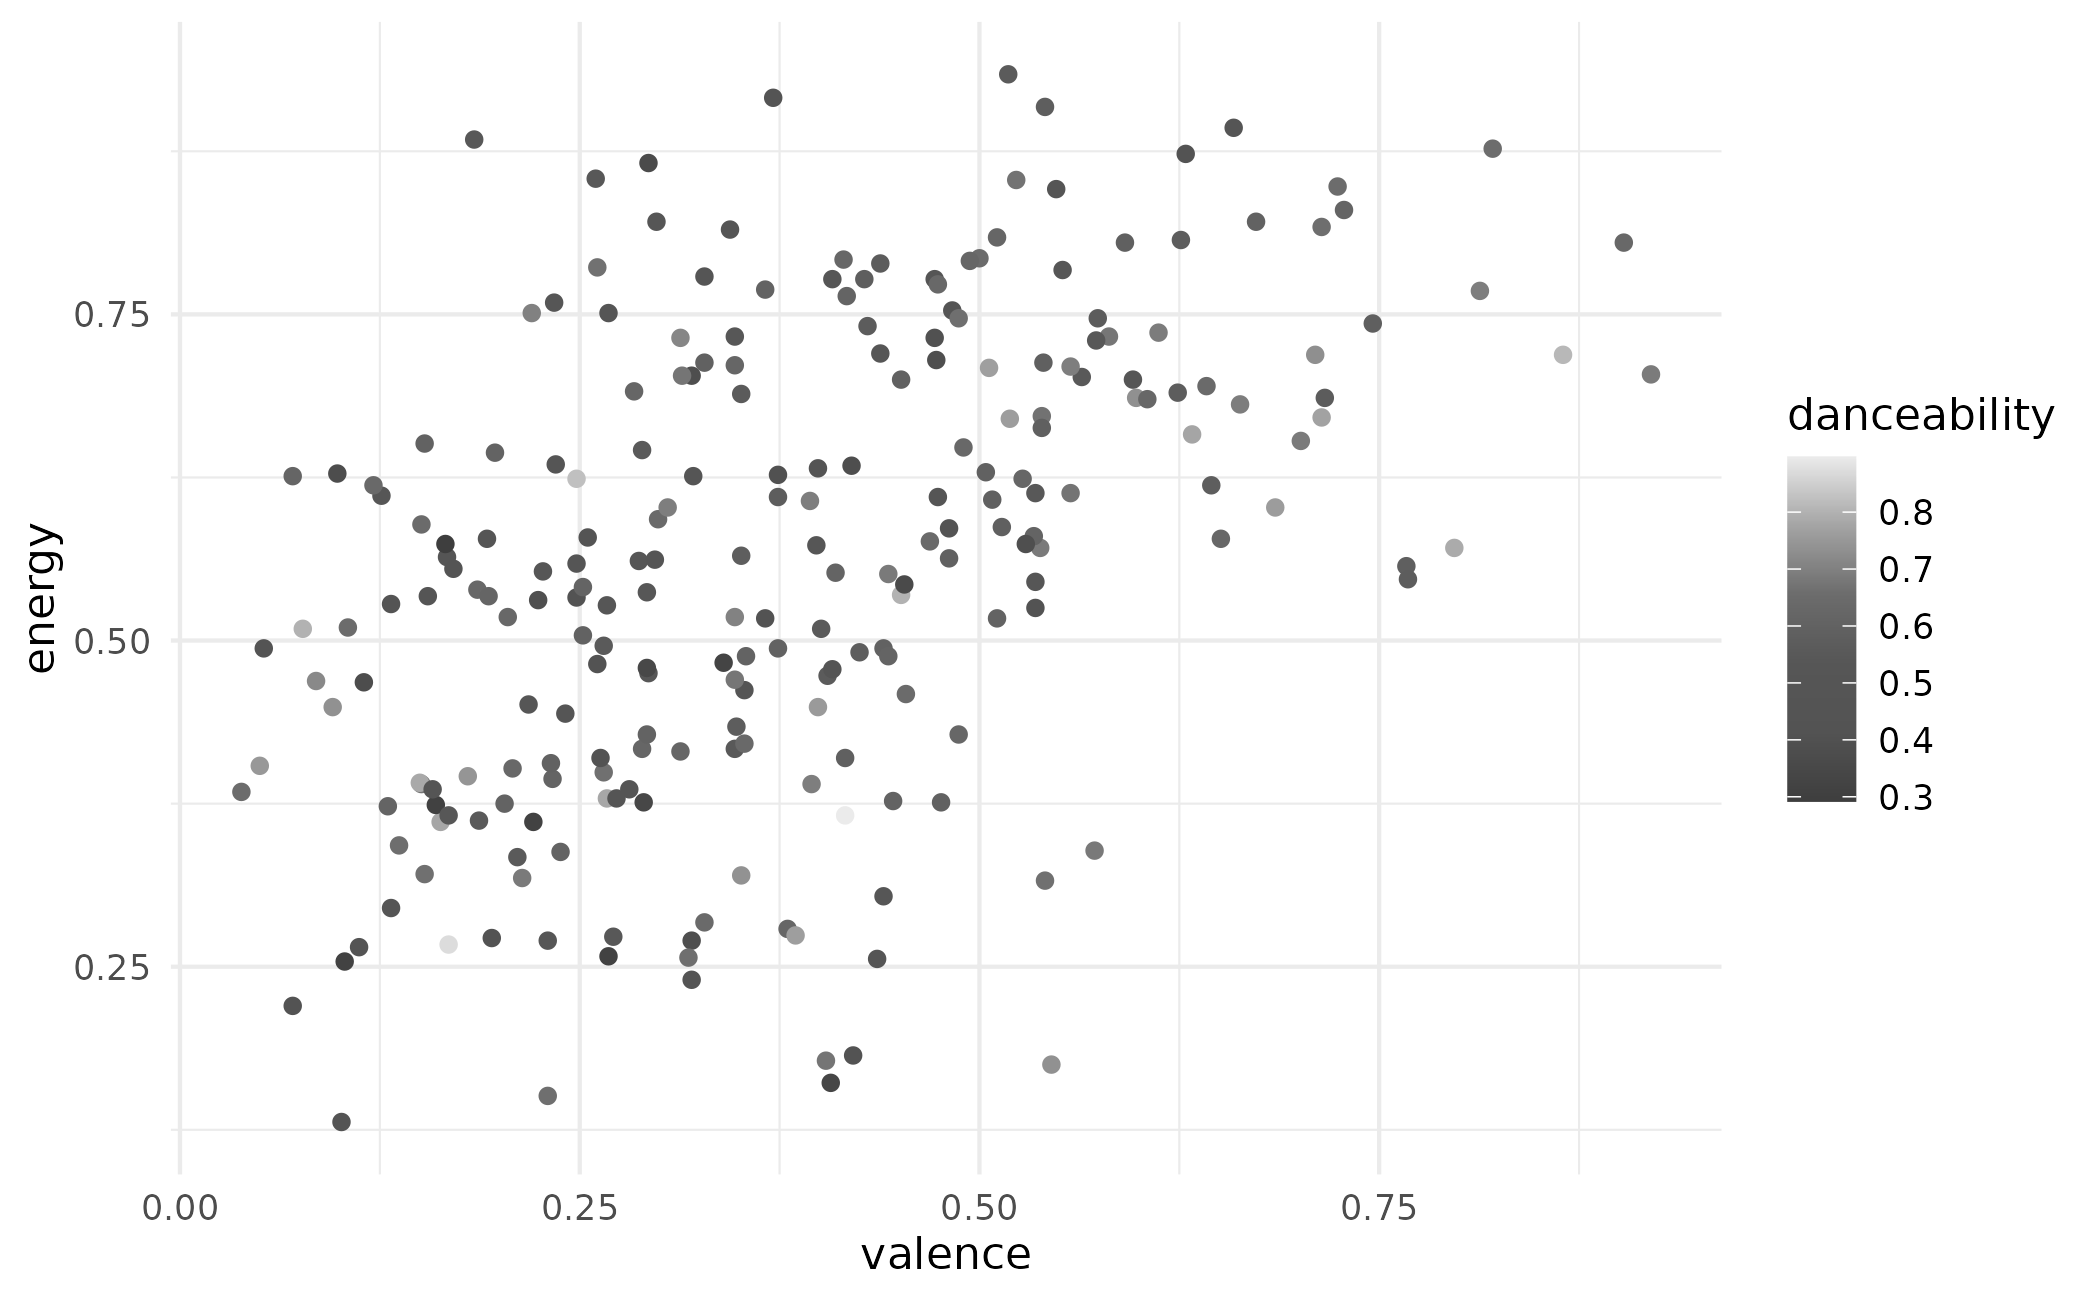
Taylor Swift colour scales based on album cover palettes
Source:R/ggplot2-color-scales.R
scale_taylor.RdTaylor Swift colour scales based on album cover palettes
Usage
scale_colour_taylor_d(
  ...,
  alpha = 1,
  begin = 0,
  end = 1,
  direction = 1,
  album = "Lover",
  aesthetics = "colour"
)

scale_color_taylor_d(
  ...,
  alpha = 1,
  begin = 0,
  end = 1,
  direction = 1,
  album = "Lover",
  aesthetics = "colour"
)

scale_fill_taylor_d(
  ...,
  alpha = 1,
  begin = 0,
  end = 1,
  direction = 1,
  album = "Lover",
  aesthetics = "fill"
)

scale_colour_taylor_c(
  ...,
  alpha = 1,
  begin = 0,
  end = 1,
  direction = 1,
  album = "Lover",
  values = NULL,
  space = "Lab",
  na.value = "grey50",
  guide = "colourbar",
  aesthetics = "colour"
)

scale_color_taylor_c(
  ...,
  alpha = 1,
  begin = 0,
  end = 1,
  direction = 1,
  album = "Lover",
  values = NULL,
  space = "Lab",
  na.value = "grey50",
  guide = "colourbar",
  aesthetics = "colour"
)

scale_fill_taylor_c(
  ...,
  alpha = 1,
  begin = 0,
  end = 1,
  direction = 1,
  album = "Lover",
  values = NULL,
  space = "Lab",
  na.value = "grey50",
  guide = "colourbar",
  aesthetics = "fill"
)

scale_colour_taylor_b(
  ...,
  alpha = 1,
  begin = 0,
  end = 1,
  direction = 1,
  album = "Lover",
  values = NULL,
  space = "Lab",
  na.value = "grey50",
  guide = "coloursteps",
  aesthetics = "colour"
)

scale_color_taylor_b(
  ...,
  alpha = 1,
  begin = 0,
  end = 1,
  direction = 1,
  album = "Lover",
  values = NULL,
  space = "Lab",
  na.value = "grey50",
  guide = "coloursteps",
  aesthetics = "colour"
)

scale_fill_taylor_b(
  ...,
  alpha = 1,
  begin = 0,
  end = 1,
  direction = 1,
  album = "Lover",
  values = NULL,
  space = "Lab",
  na.value = "grey50",
  guide = "coloursteps",
  aesthetics = "fill"
)
Arguments
- ...
Other arguments passed on to
ggplot2::discrete_scale(),ggplot2::continuous_scale(), orggplot2::binned_scale()to control name, limits, breaks, labels and so forth.- alpha
The alpha transparency, a number in [0,1], see argument alpha in
hsv.- begin, end
The (corrected) hue in
[0,1]at which the color map begins and ends.- direction
Sets the order of colors in the scale. If 1, the default, colors are ordered from darkest to lightest. If -1, the order of colors is reversed.
- album
A character string indicating the album that should be used for the palette.
- aesthetics
Character string or vector of character strings listing the name(s) of the aesthetic(s) that this scale works with. This can be useful, for example, to apply colour settings to the
colourandfillaesthetics at the same time, viaaesthetics = c("colour", "fill").- values
if colours should not be evenly positioned along the gradient this vector gives the position (between 0 and 1) for each colour in the
coloursvector. Seerescale()for a convenience function to map an arbitrary range to between 0 and 1.- space
colour space in which to calculate gradient. Must be "Lab" - other values are deprecated.
- na.value
Missing values will be replaced with this value.
- guide
A function used to create a guide or its name. See
guides()for more information.
Value
A color scale for use in plots created with ggplot2::ggplot().
Examples
# use taylor_d with discrete data
library(ggplot2)
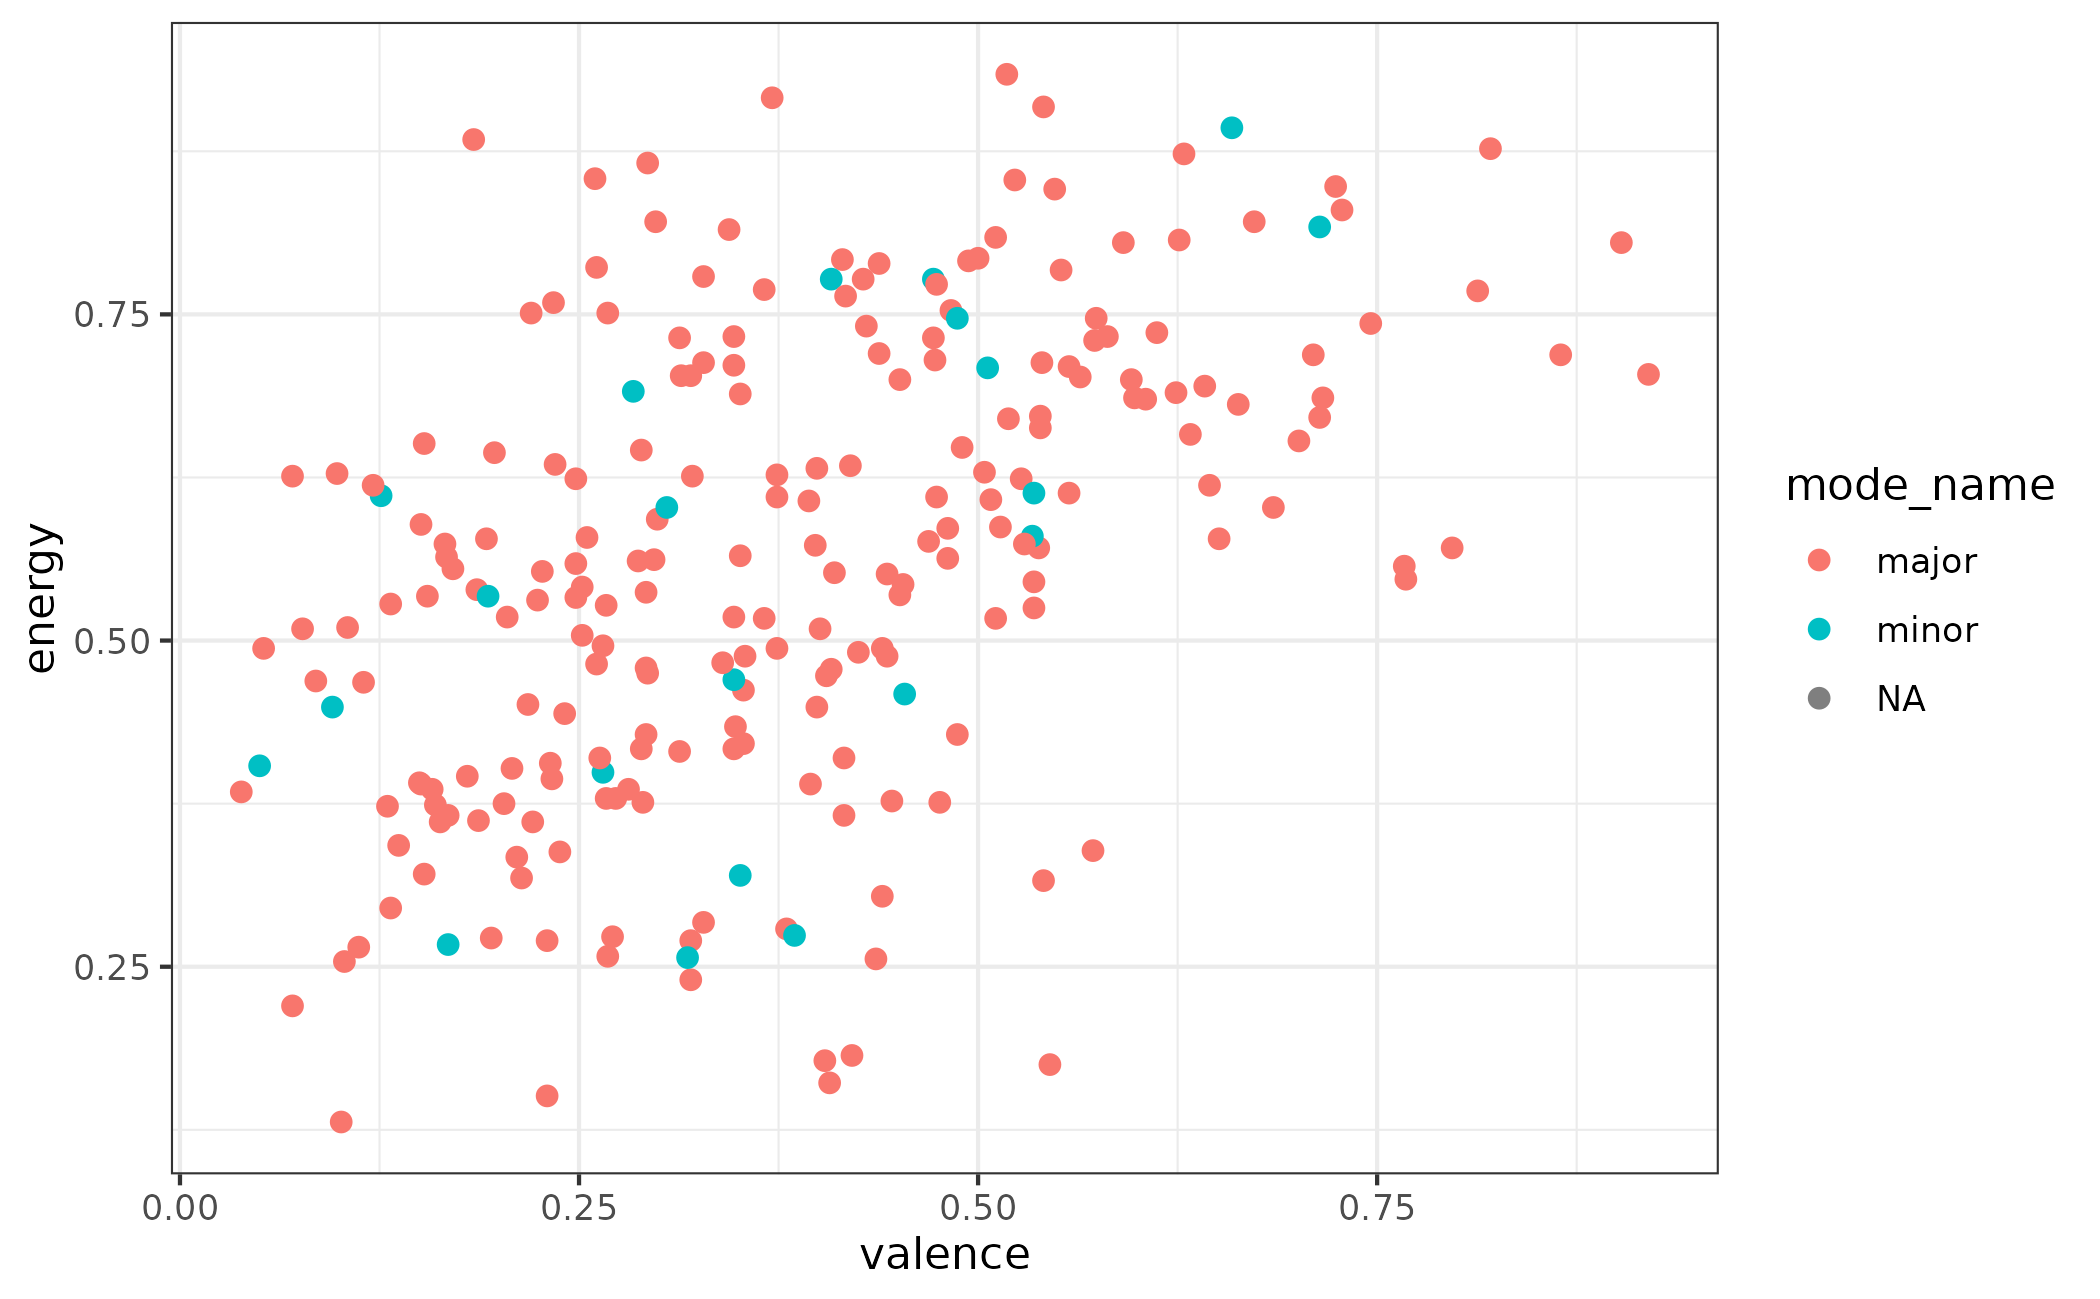
(p <- ggplot(taylor_album_songs, aes(x = valence, y = energy)) +
geom_point(aes(color = mode_name), size = 2) +
theme_bw())
#> Warning: Removed 3 rows containing missing values or values outside the scale range
#> (`geom_point()`).
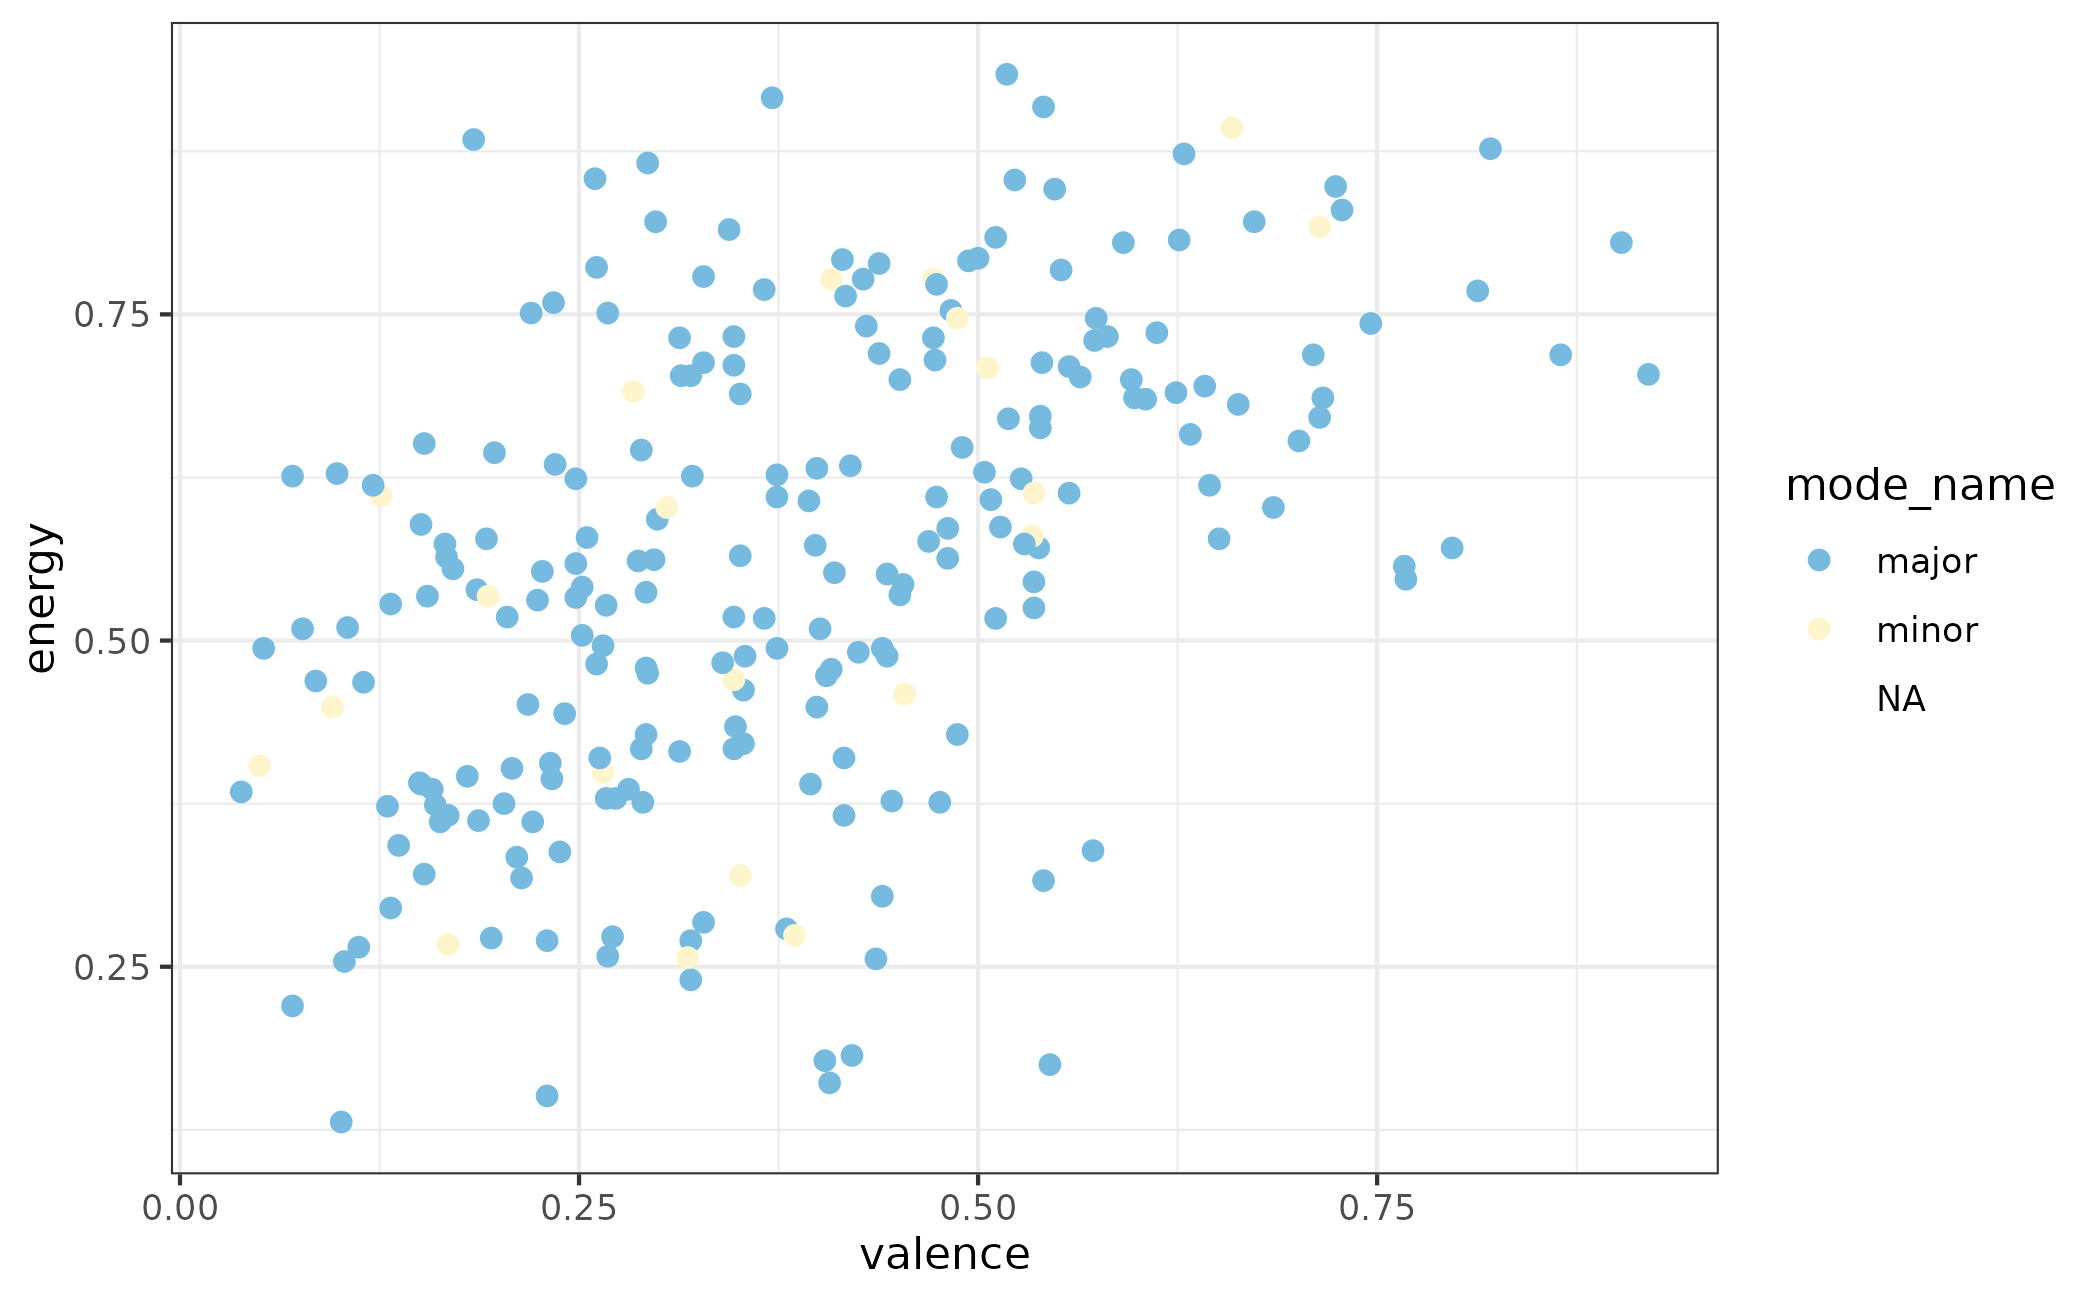
 p + scale_color_taylor_d()
#> Warning: Removed 3 rows containing missing values or values outside the scale range
#> (`geom_point()`).
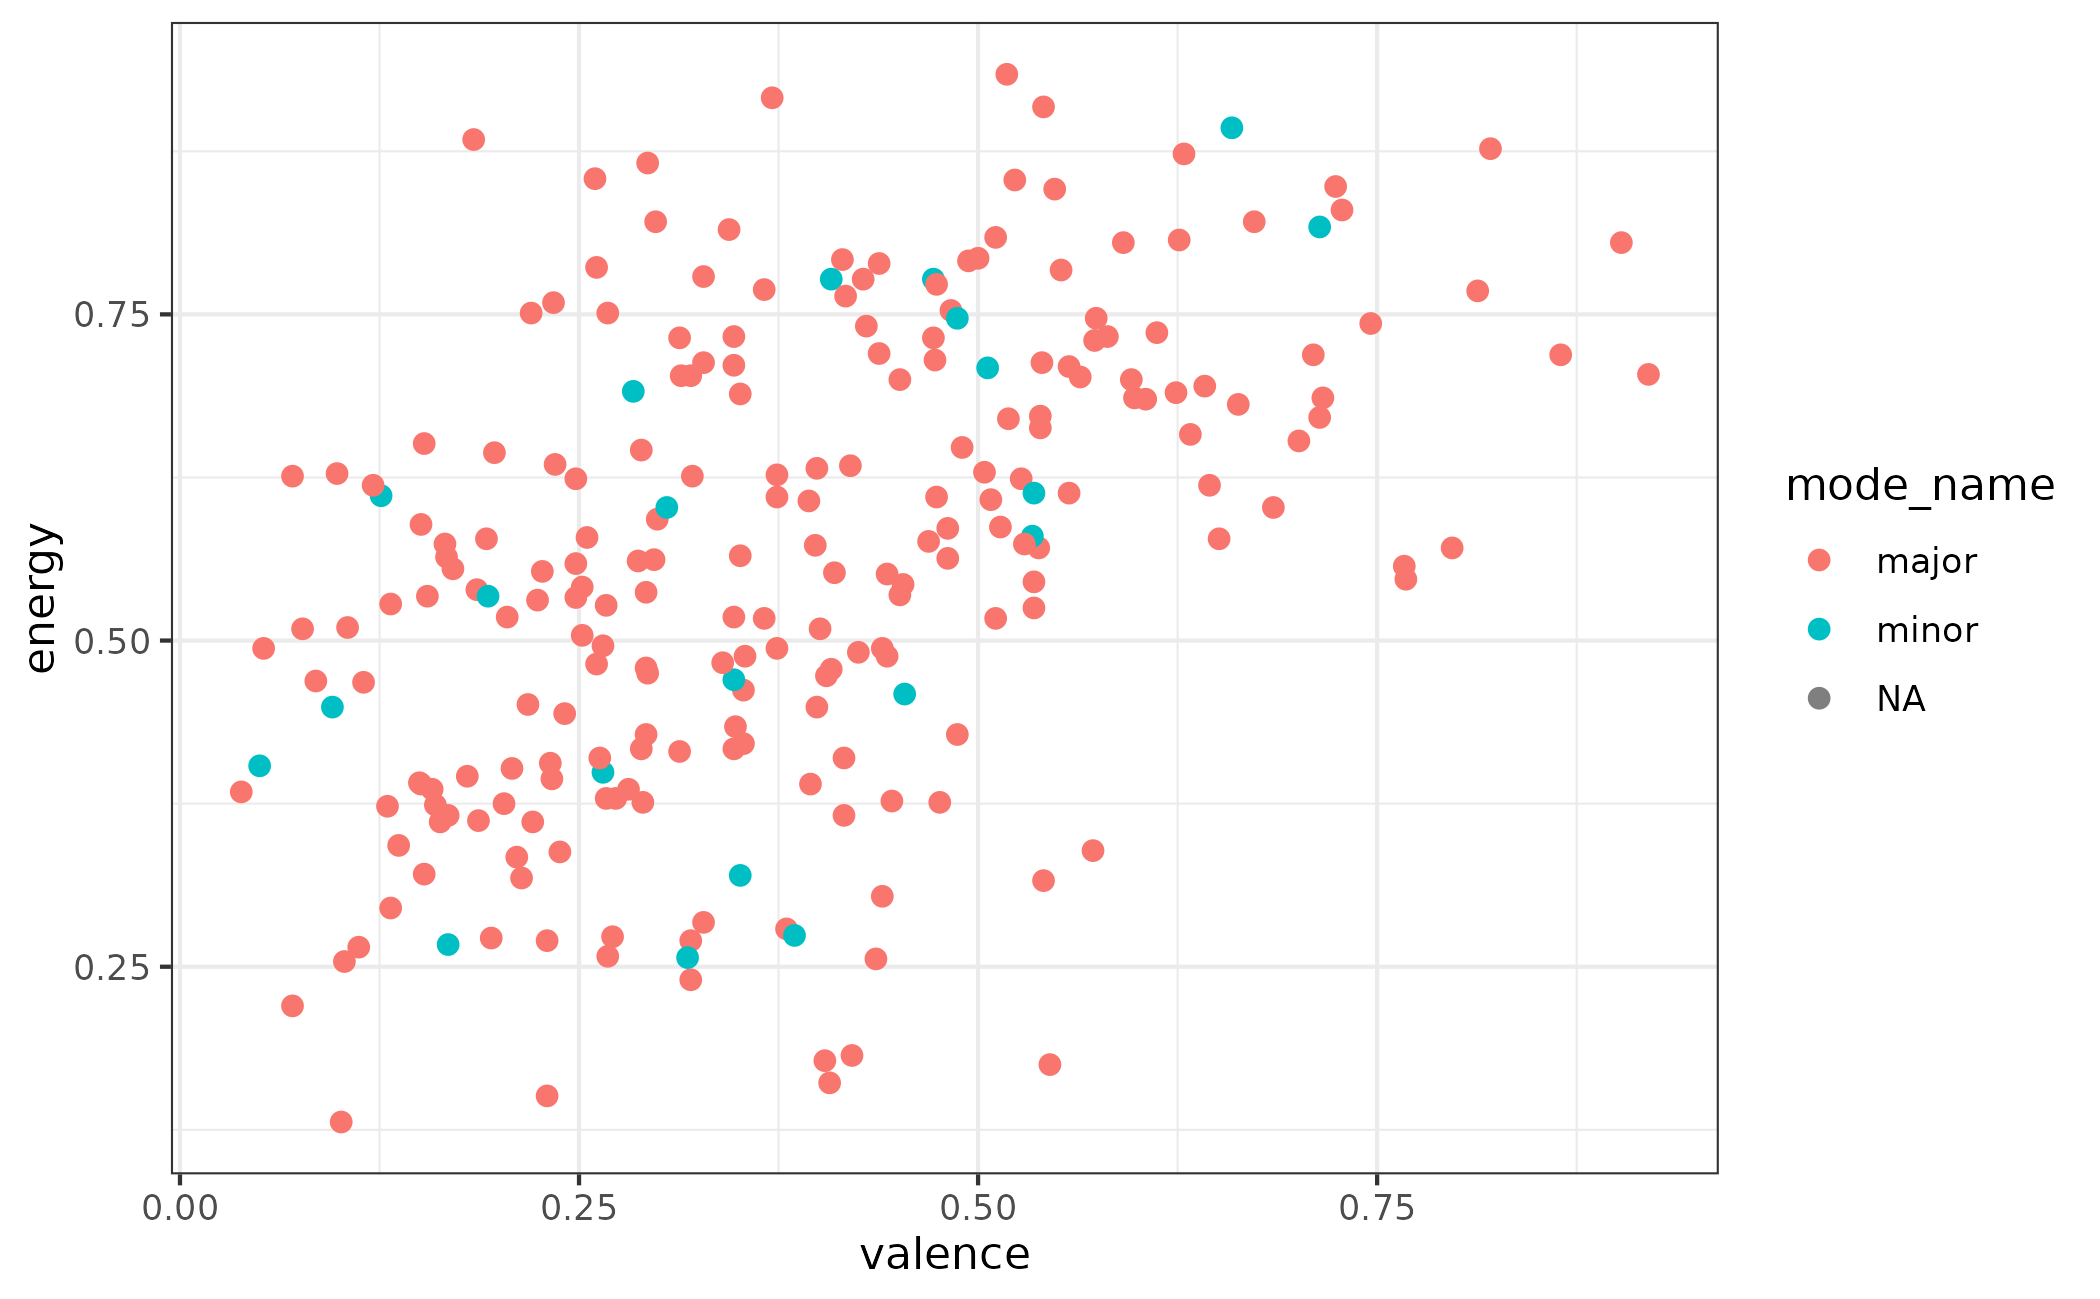
 # change scale label
p + scale_fill_taylor_d("Mode of Track")
#> Warning: Removed 3 rows containing missing values or values outside the scale range
#> (`geom_point()`).
 # select album palette to use, see ?taylor::album_palettes for more details
lover <- subset(taylor_album_songs, album_name == "Lover")
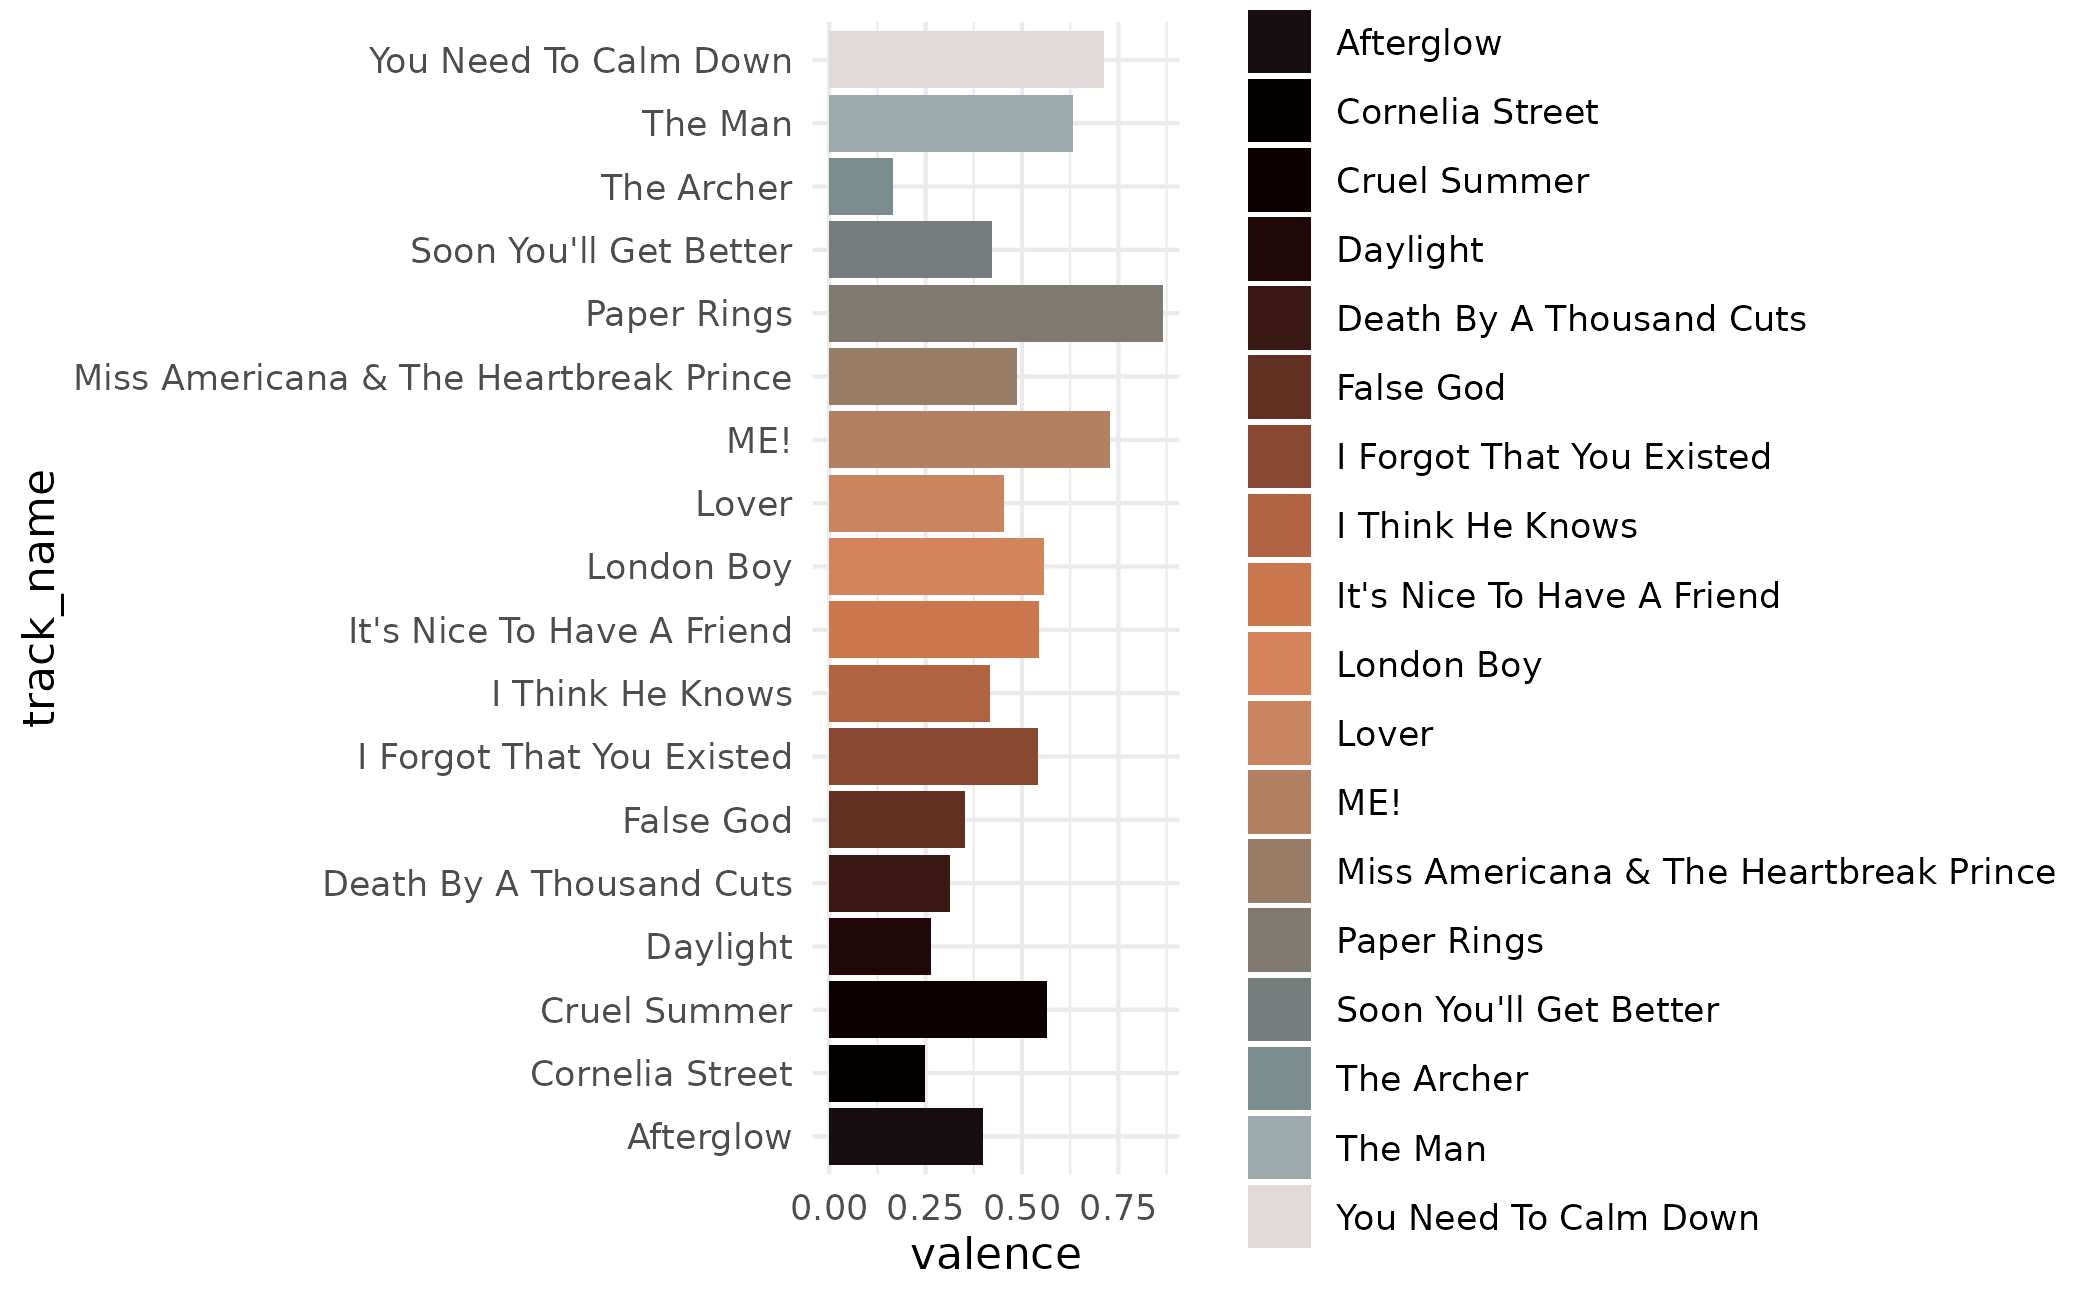
(p <- ggplot(lover, aes(x = valence, y = track_name)) +
geom_col(aes(fill = track_name)) +
theme_minimal())
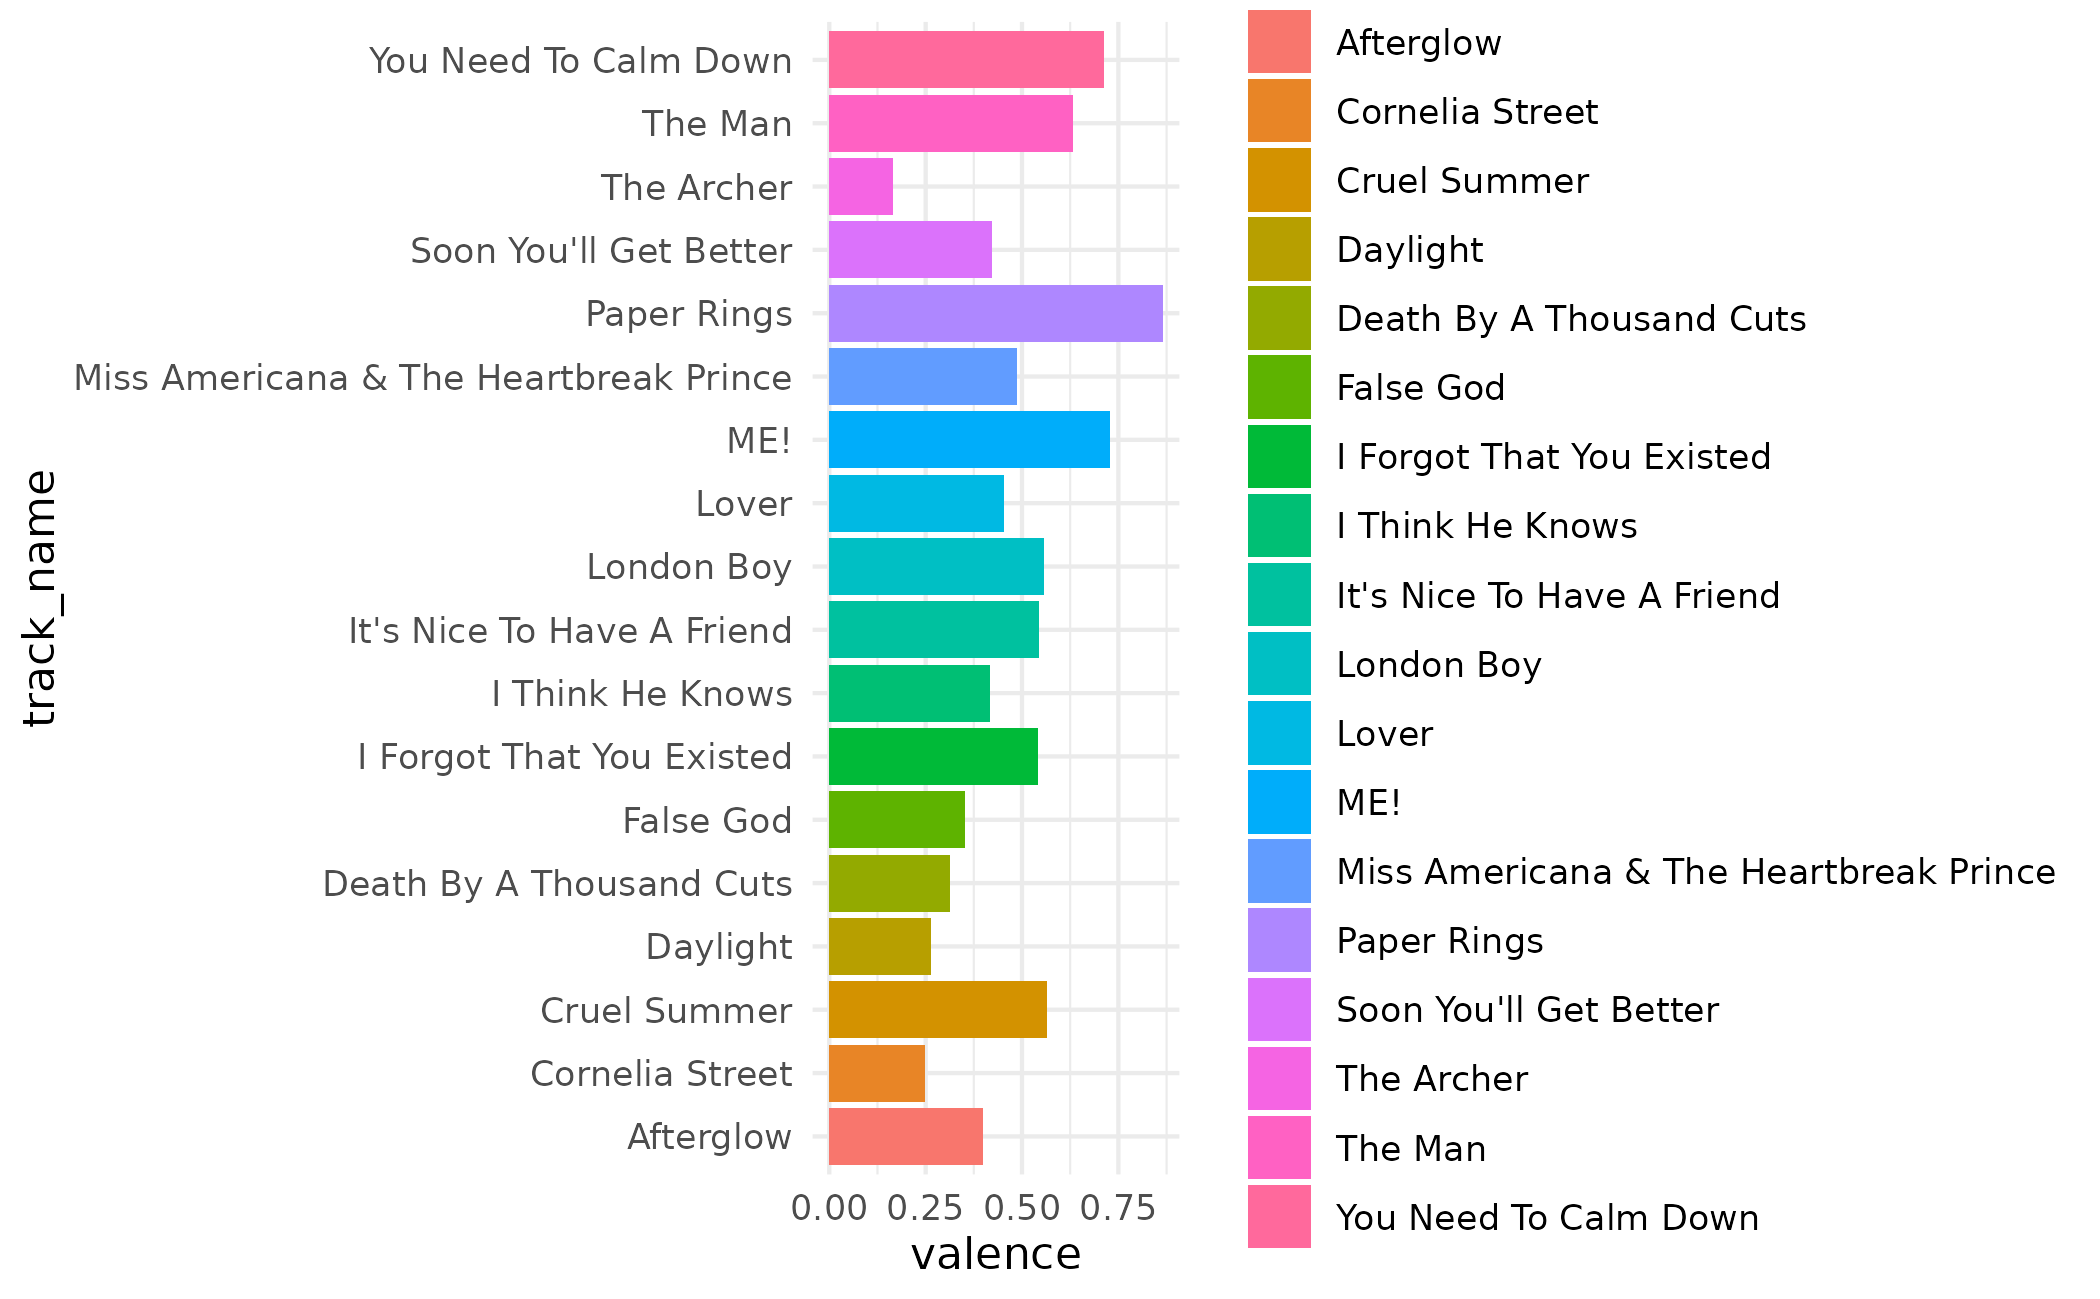 p + scale_fill_taylor_d(album = "Lover")
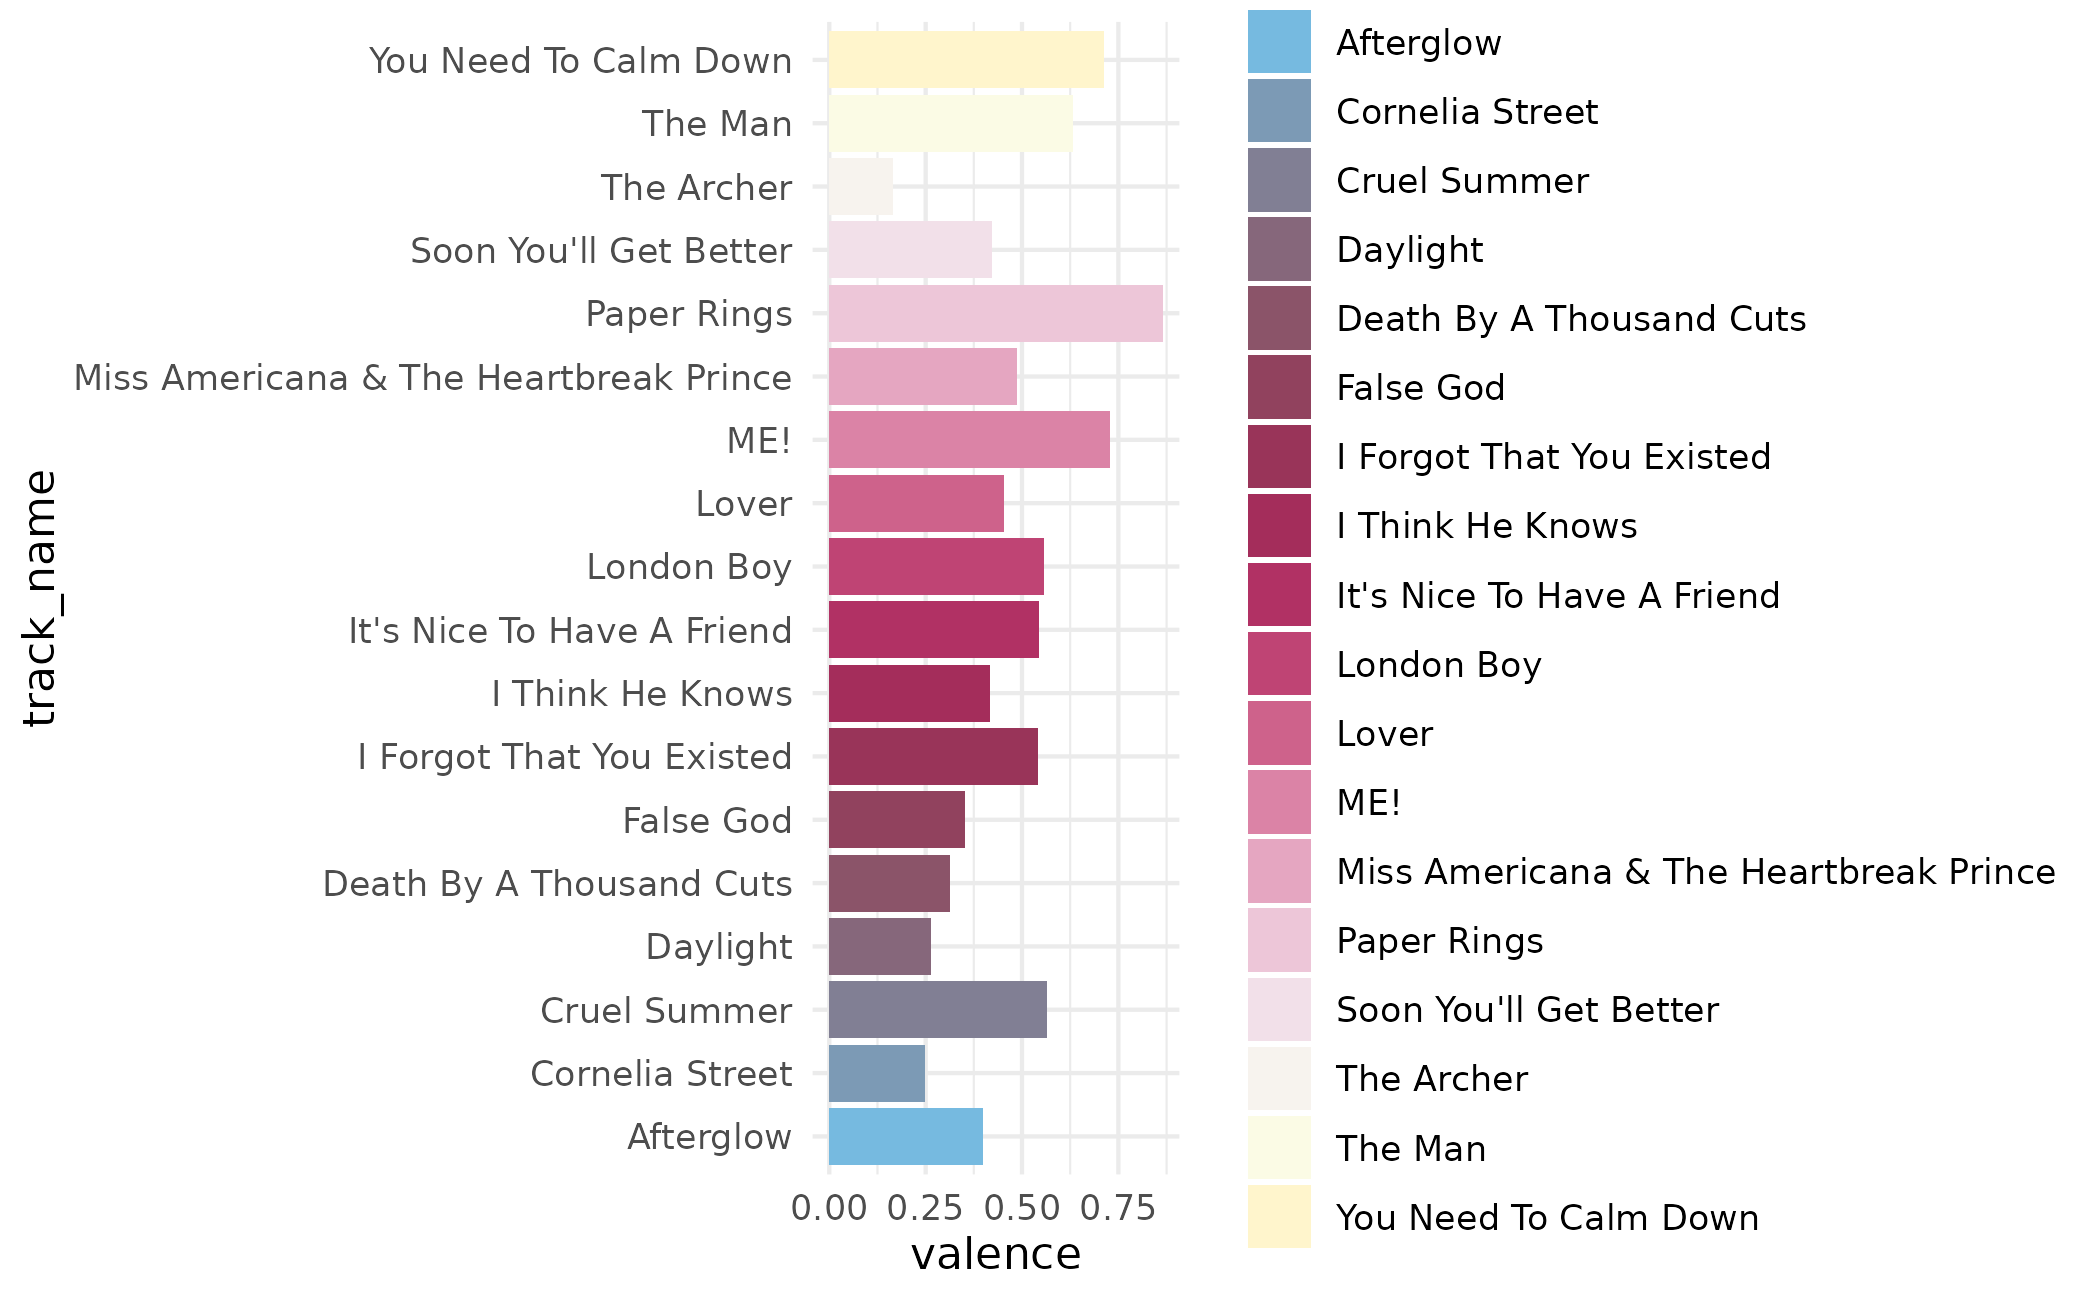 p + scale_fill_taylor_d(album = "evermore")
 # use taylor_c with continuous data
(p <- ggplot(taylor_album_songs, aes(valence, energy)) +
geom_point(aes(color = danceability)) +
theme_minimal())
#> Warning: Removed 3 rows containing missing values or values outside the scale range
#> (`geom_point()`).
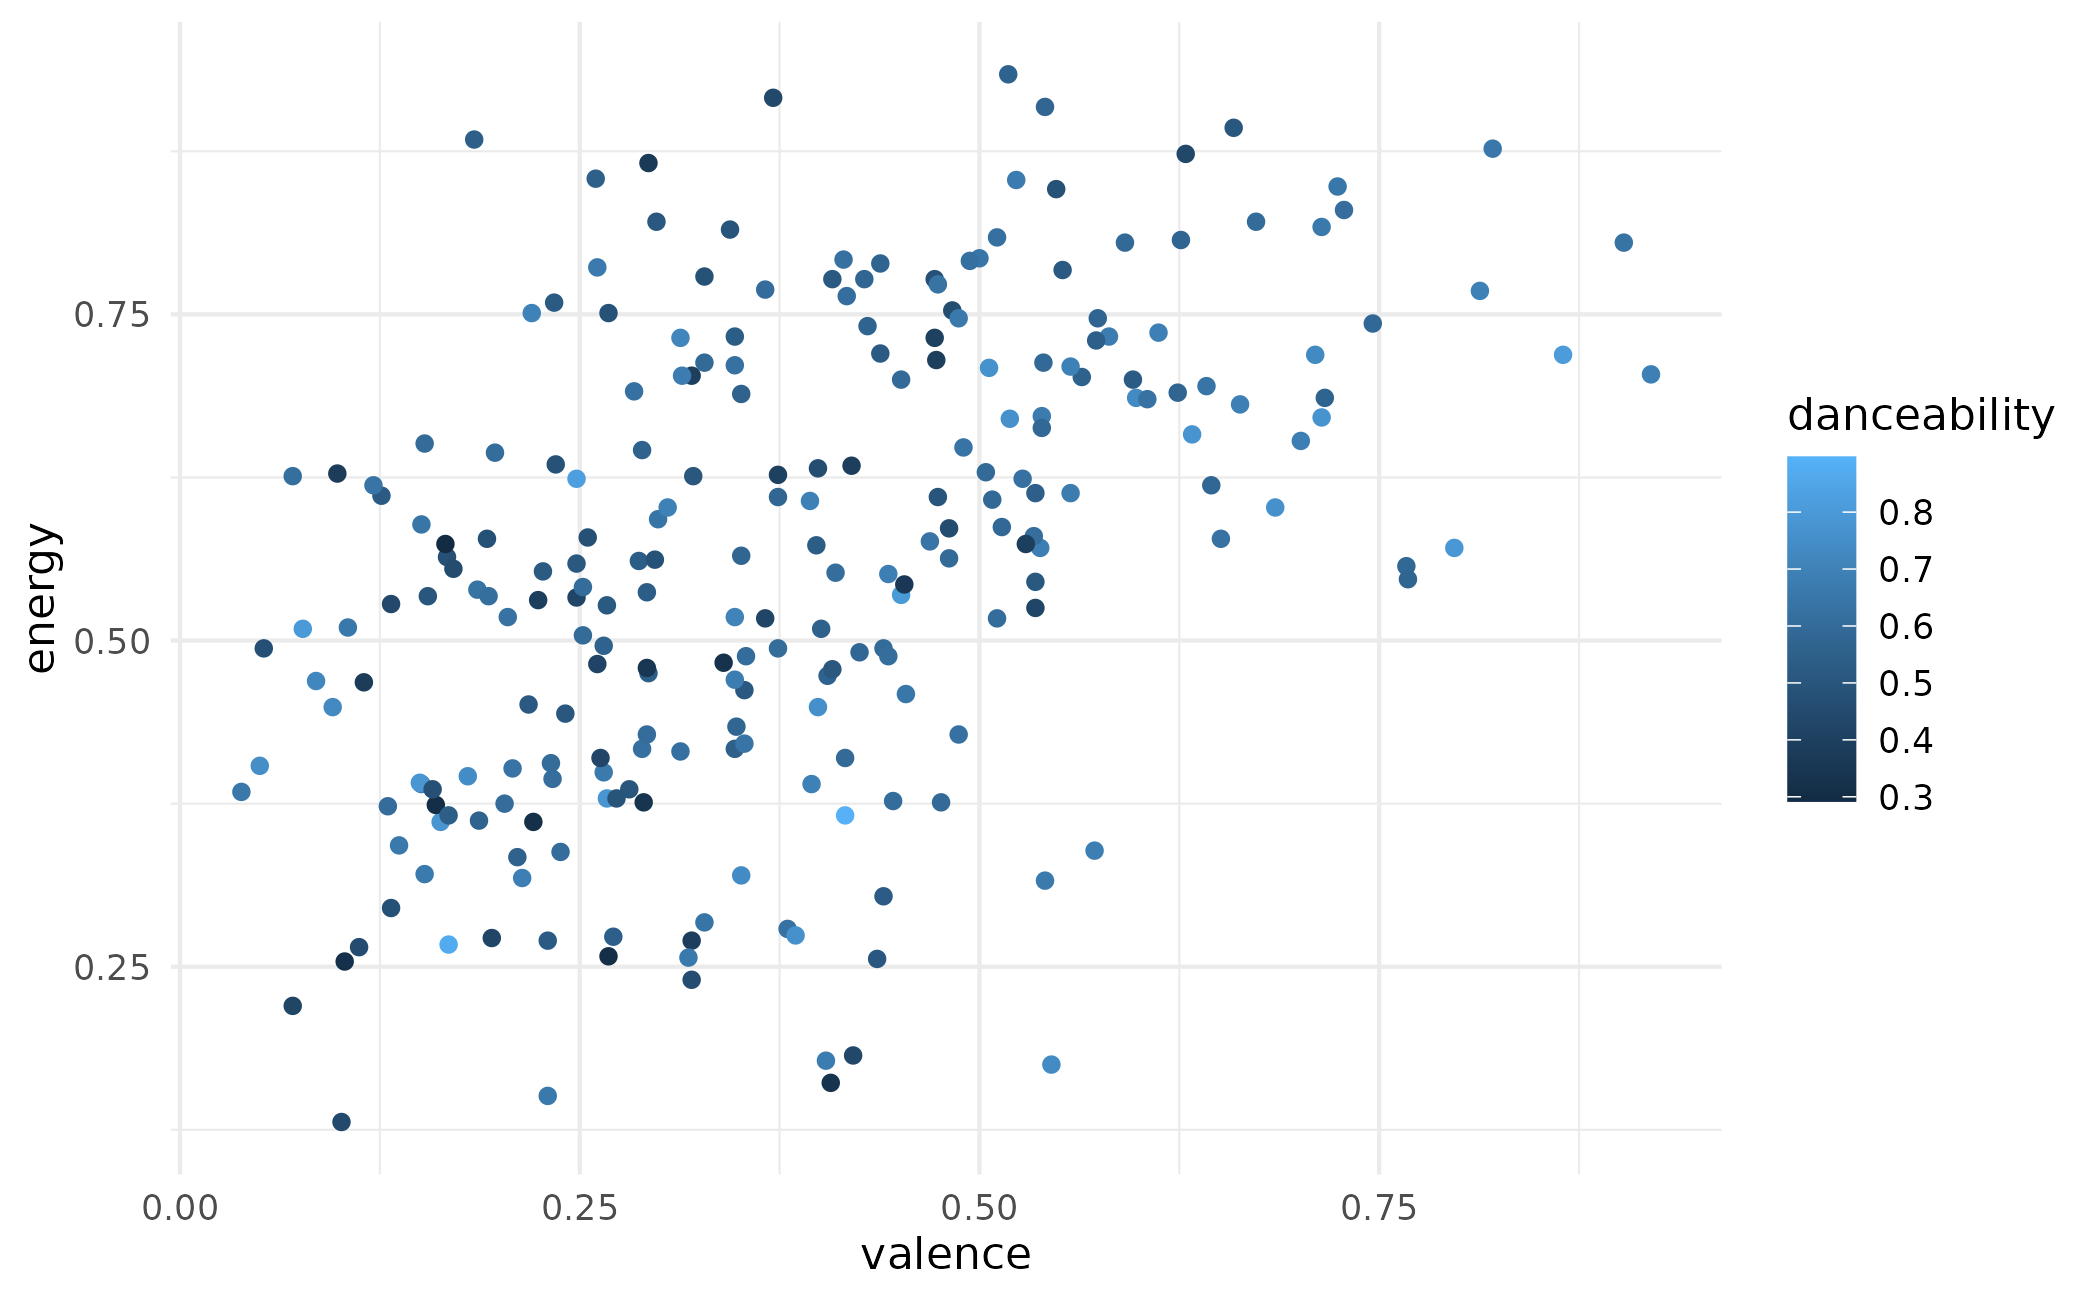 p + scale_color_taylor_c(album = "Fearless")
#> Warning: Removed 3 rows containing missing values or values outside the scale range
#> (`geom_point()`).
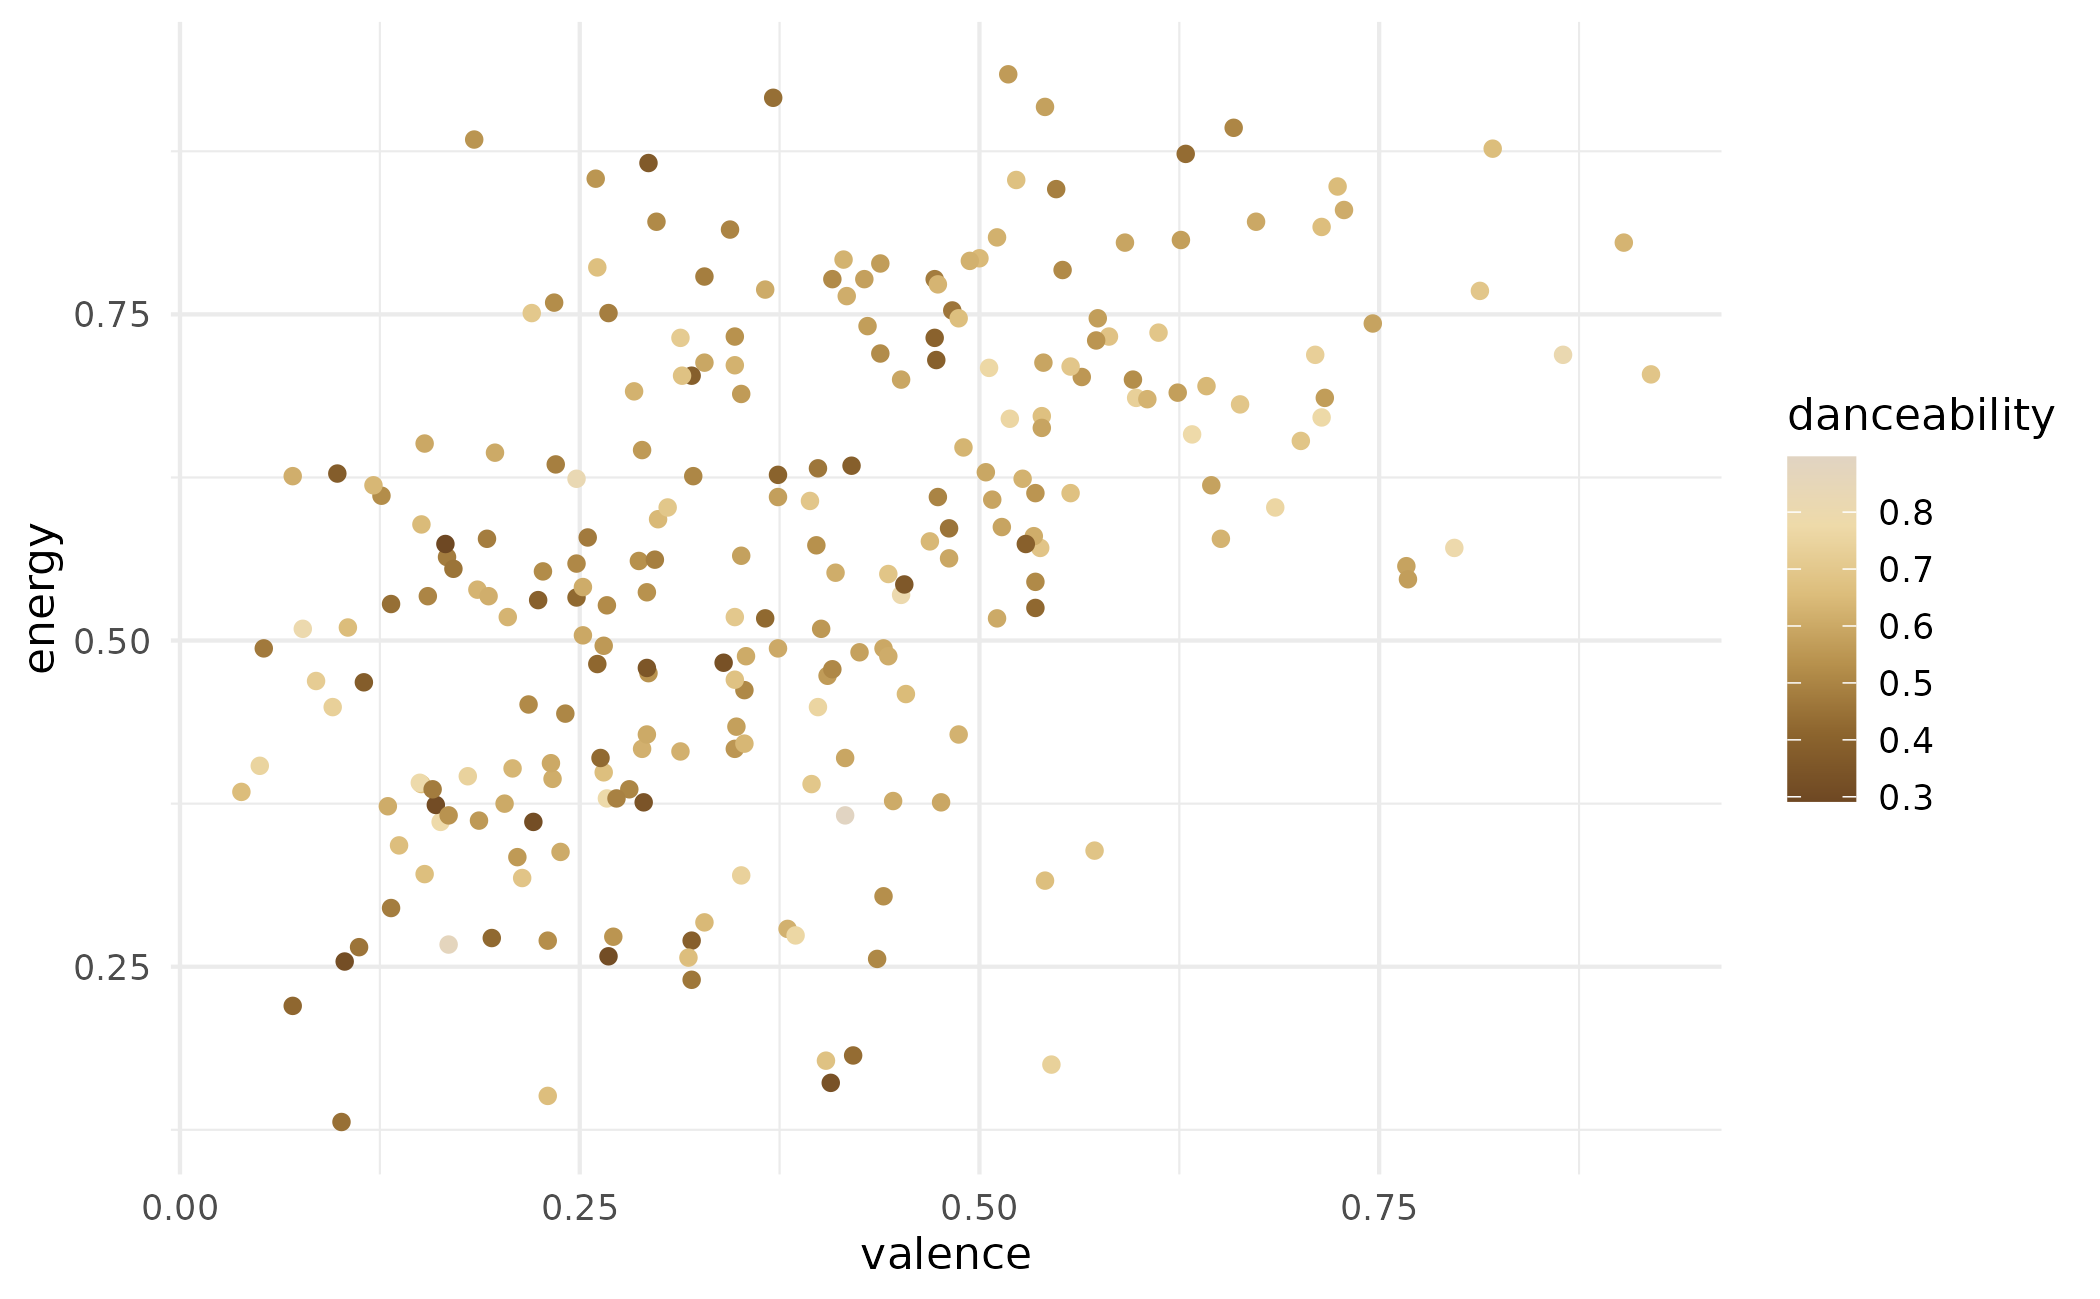 p + scale_color_taylor_c(album = "folklore")
#> Warning: Removed 3 rows containing missing values or values outside the scale range
#> (`geom_point()`).
