The taylor package comes with it’s own class of color palettes, inspired by the work of Josiah Parry in the cpcinema package.
Creating palettes
taylor uses vctrs to create a
special vector class of color palettes that can be used to create and
visualize palettes. We can create a palette using the
color_palette() function. We only have to pass a vector of
hexadecimal values or valid R color (from colors()), and a
palette is created that will print a preview of the colors.
library(taylor)

my_pal <- color_palette(c("firebrick", "turquoise", "#0051ba"))
my_pal
#> <color_palette[3]>
#>     firebrick
#>     turquoise
#>     #0051ba
We can also use color_palette() on an existing palette
to interpolate additional values, by specifying that we want more colors
than were originally specified.
my_big_pal <- color_palette(my_pal, n = 10)
my_big_pal
#> <color_palette[10]>
#>     #B22222
#>     #984C48
#>     #7F766F
#>     #66A096
#>     #4CCABC
#>     #38D0CD
#>     #2AB0C8
#>     #1C90C3
#>     #0E70BE
#>     #0051BA
Similarly, if we have a large color palette, we can select just a few representative colors.
my_small_pal <- color_palette(my_big_pal, n = 5)
my_small_pal
#> <color_palette[5]>
#>     #B22222
#>     #7F766F
#>     #4CCABC
#>     #2AB0C8
#>     #0051BA
Built-in palettes
The taylor package comes with a few palettes built-in, based on
Taylor Swift’s album covers. They can be viewed using
?album_palettes.
album_palettes
#> $taylor_swift
#> <color_palette[5]>
#>     #1D4737
#>     #81A757
#>     #1BAEC6
#>     #523d28
#>     #E7DBCC
#>
#> $fearless
#> <color_palette[5]>
#>     #6E4823
#>     #976F34
#>     #CBA863
#>     #ECD59F
#>     #E1D4C2
#>
#> $speak_now
#> <color_palette[5]>
#>     #2E1924
#>     #6C3127
#>     #833C63
#>     #D1A0C7
#>     #F5E8E2
#>
#> $red
#> <color_palette[5]>
#>     #201F39
#>     #A91E47
#>     #7E6358
#>     #B0A49A
#>     #DDD8C9
#>
#> $`1989`
#> <color_palette[5]>
#>     #5D4E5D
#>     #846578
#>     #92573C
#>     #C6B69C
#>     #D8D8CF
#>
#> $reputation
#> <color_palette[5]>
#>     #2C2C2C
#>     #515151
#>     #5B5B5B
#>     #6E6E6E
#>     #B9B9B9
#>
#> $lover
#> <color_palette[5]>
#>     #76BAE0
#>     #8C4F66
#>     #B8396B
#>     #EBBED3
#>     #FFF5CC
#>
#> $folklore
#> <color_palette[5]>
#>     #3E3E3E
#>     #545454
#>     #5C5C5C
#>     #949494
#>     #EBEBEB
#>
#> $evermore
#> <color_palette[5]>
#>     #160E10
#>     #421E18
#>     #D37F55
#>     #85796D
#>     #E0D9D7
#>
#> $fearless_tv
#> <color_palette[5]>
#>     #624324
#>     #A47F45
#>     #CAA462
#>     #C5AA7C
#>     #EEDBA9
#>
#> $red_tv
#> <color_palette[5]>
#>     #400303
#>     #731803
#>     #967862
#>     #B38468
#>     #C7C5B6
#>
#> $midnights
#> <color_palette[5]>
#>     #121D27
#>     #5A658B
#>     #6F86A2
#>     #85A7BA
#>     #AA9EB6
#>
#> $speak_now_tv
#> <color_palette[5]>
#>     #2A122C
#>     #4a2454
#>     #72325F
#>     #874886
#>     #96689A
#>
#> $`1989_tv`
#> <color_palette[5]>
#>     #487398
#>     #659BBB
#>     #8BB5D2
#>     #AFC5D4
#>     #E4DFD3
#>
#> $tortured_poets
#> <color_palette[5]>
#>     #1C160F
#>     #3F3824
#>     #635B3A
#>     #ADA795
#>     #F7F4F0
#>
#> $showgirl
#> <color_palette[5]>
#>     #C44615
#>     #EB8246
#>     #F0CD92
#>     #6CAE90
#>     #3E5C38
Or we can access a single palette.
album_palettes$fearless_tv
#> <color_palette[5]>
#>     #624324
#>     #A47F45
#>     #CAA462
#>     #C5AA7C
#>     #EEDBA9
Also included is a palette that includes one representative color
from each album, ?album_compare.
album_compare
#> <color_palette[16]>
#>     taylor_swift
#>     fearless
#>     speak_now
#>     red
#>     1989
#>     reputation
#>     lover
#>     folklore
#>     evermore
#>     fearless_tv
#>     red_tv
#>     midnights
#>     speak_now_tv
#>     1989_tv
#>     tortured_poets
#>     showgirl
Using color palettes with ggplot2
The taylor package comes with a set of functions built in for
plotting in ggplot2 with the album palettes. For example, we can use
scale_fill_taylor_c() to create a continuous scale based on
one of the album palettes. For more details on how to use the scale
functions included in taylor, check out
vignette("plotting").
library(ggplot2)

p <- ggplot(faithfuld, aes(waiting, eruptions, fill = density)) +
  geom_tile() +
  theme_minimal()

p + scale_fill_taylor_c(album = "Fearless (Taylor's Version)")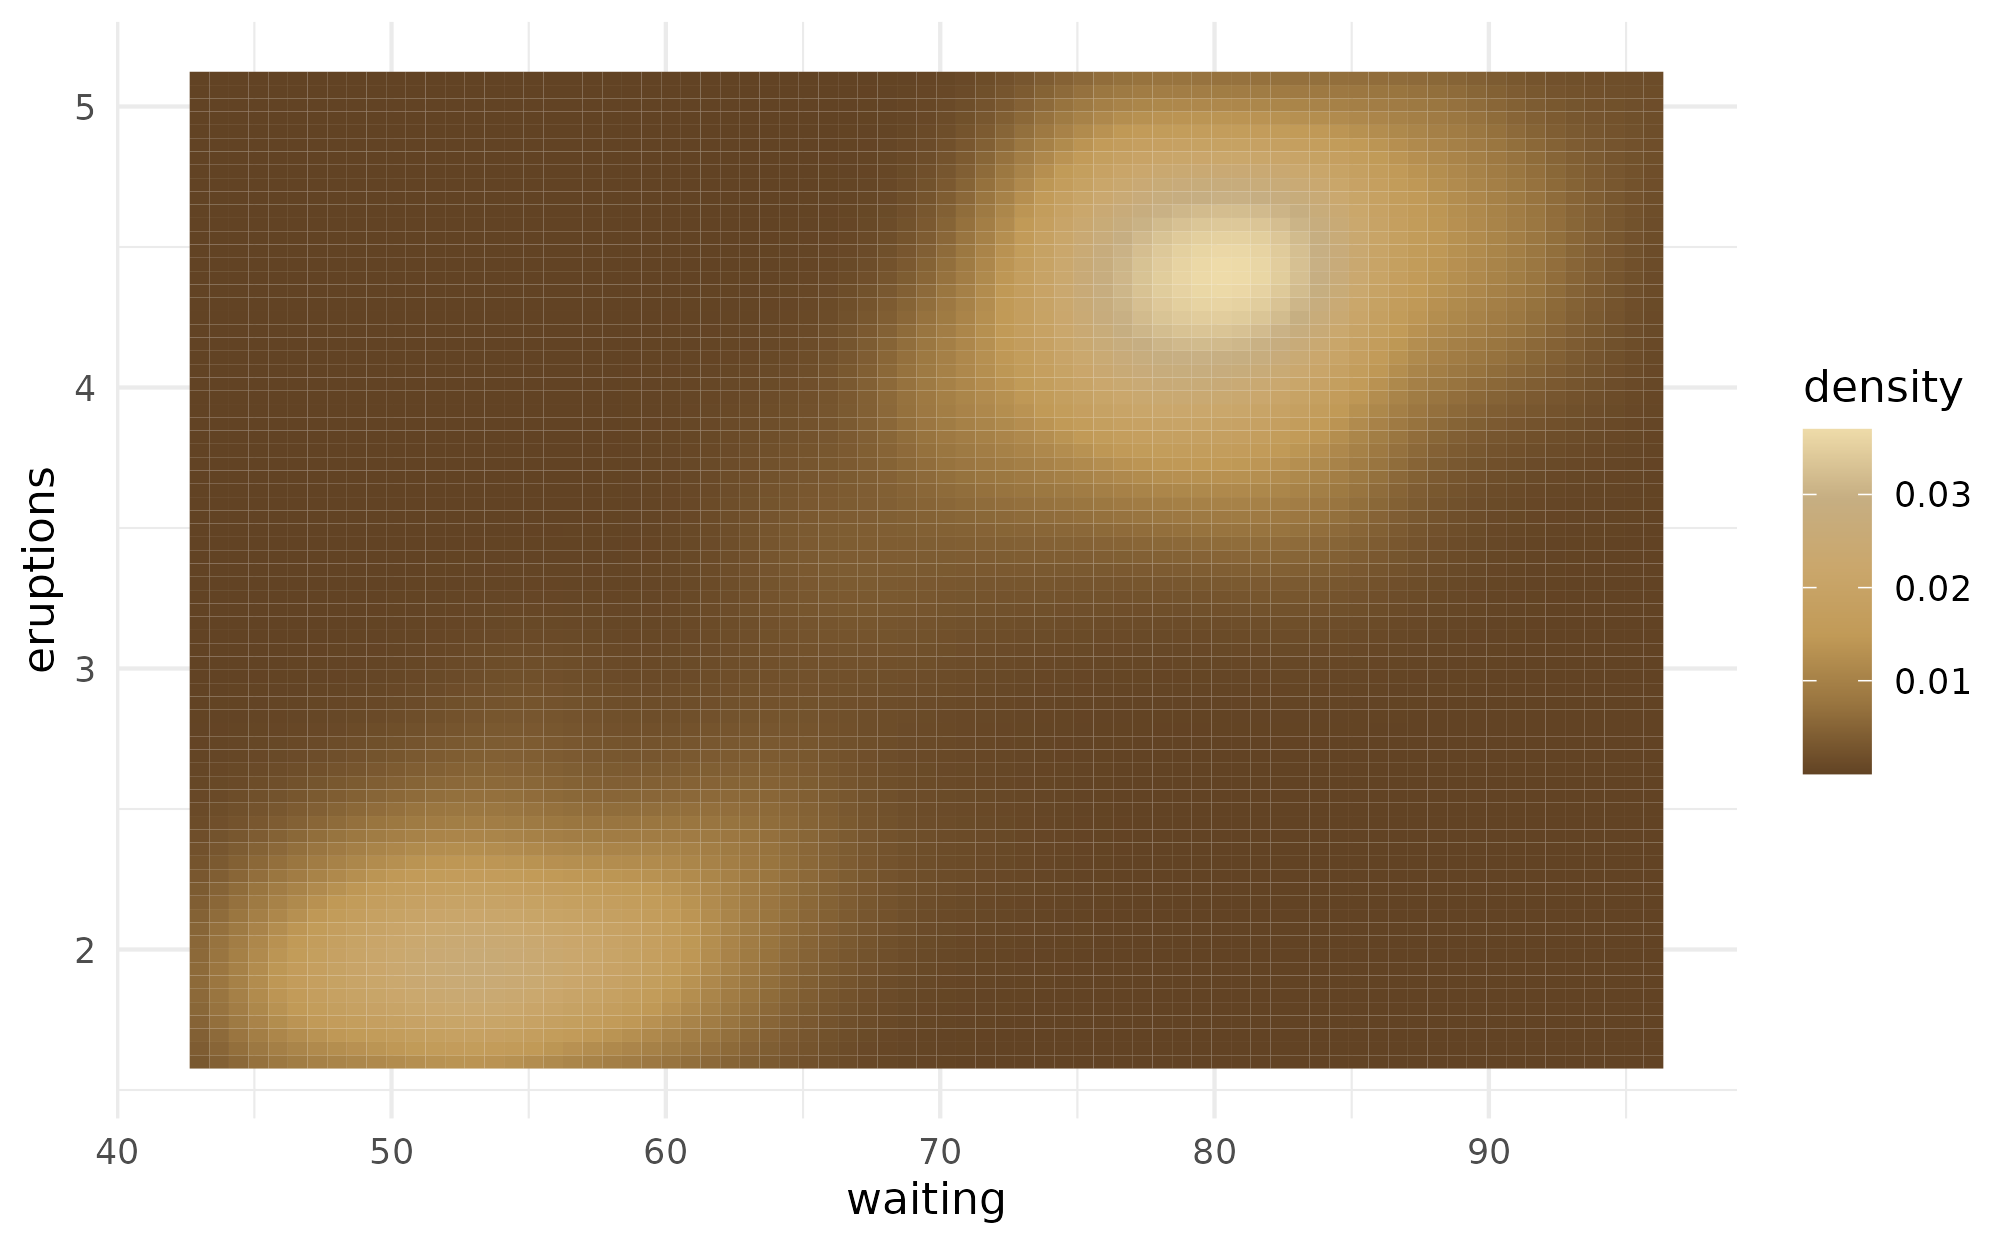
You can also use your custom palettes with ggplot2. For example, we
can create a palette of greens, and then use
ggplot2::scale_fill_gradientn() or
ggplot2::scale_color_gradientn() to use the palette.
green_pal <- color_palette(c("#E5F5E0", "#A1D99B", "#31A354"))
green_pal
#> <color_palette[3]>
#>     #E5F5E0
#>     #A1D99B
#>     #31A354

ggplot(faithfuld, aes(waiting, eruptions, fill = density)) +
  geom_tile() +
  scale_fill_gradientn(colors = green_pal) +
  theme_minimal()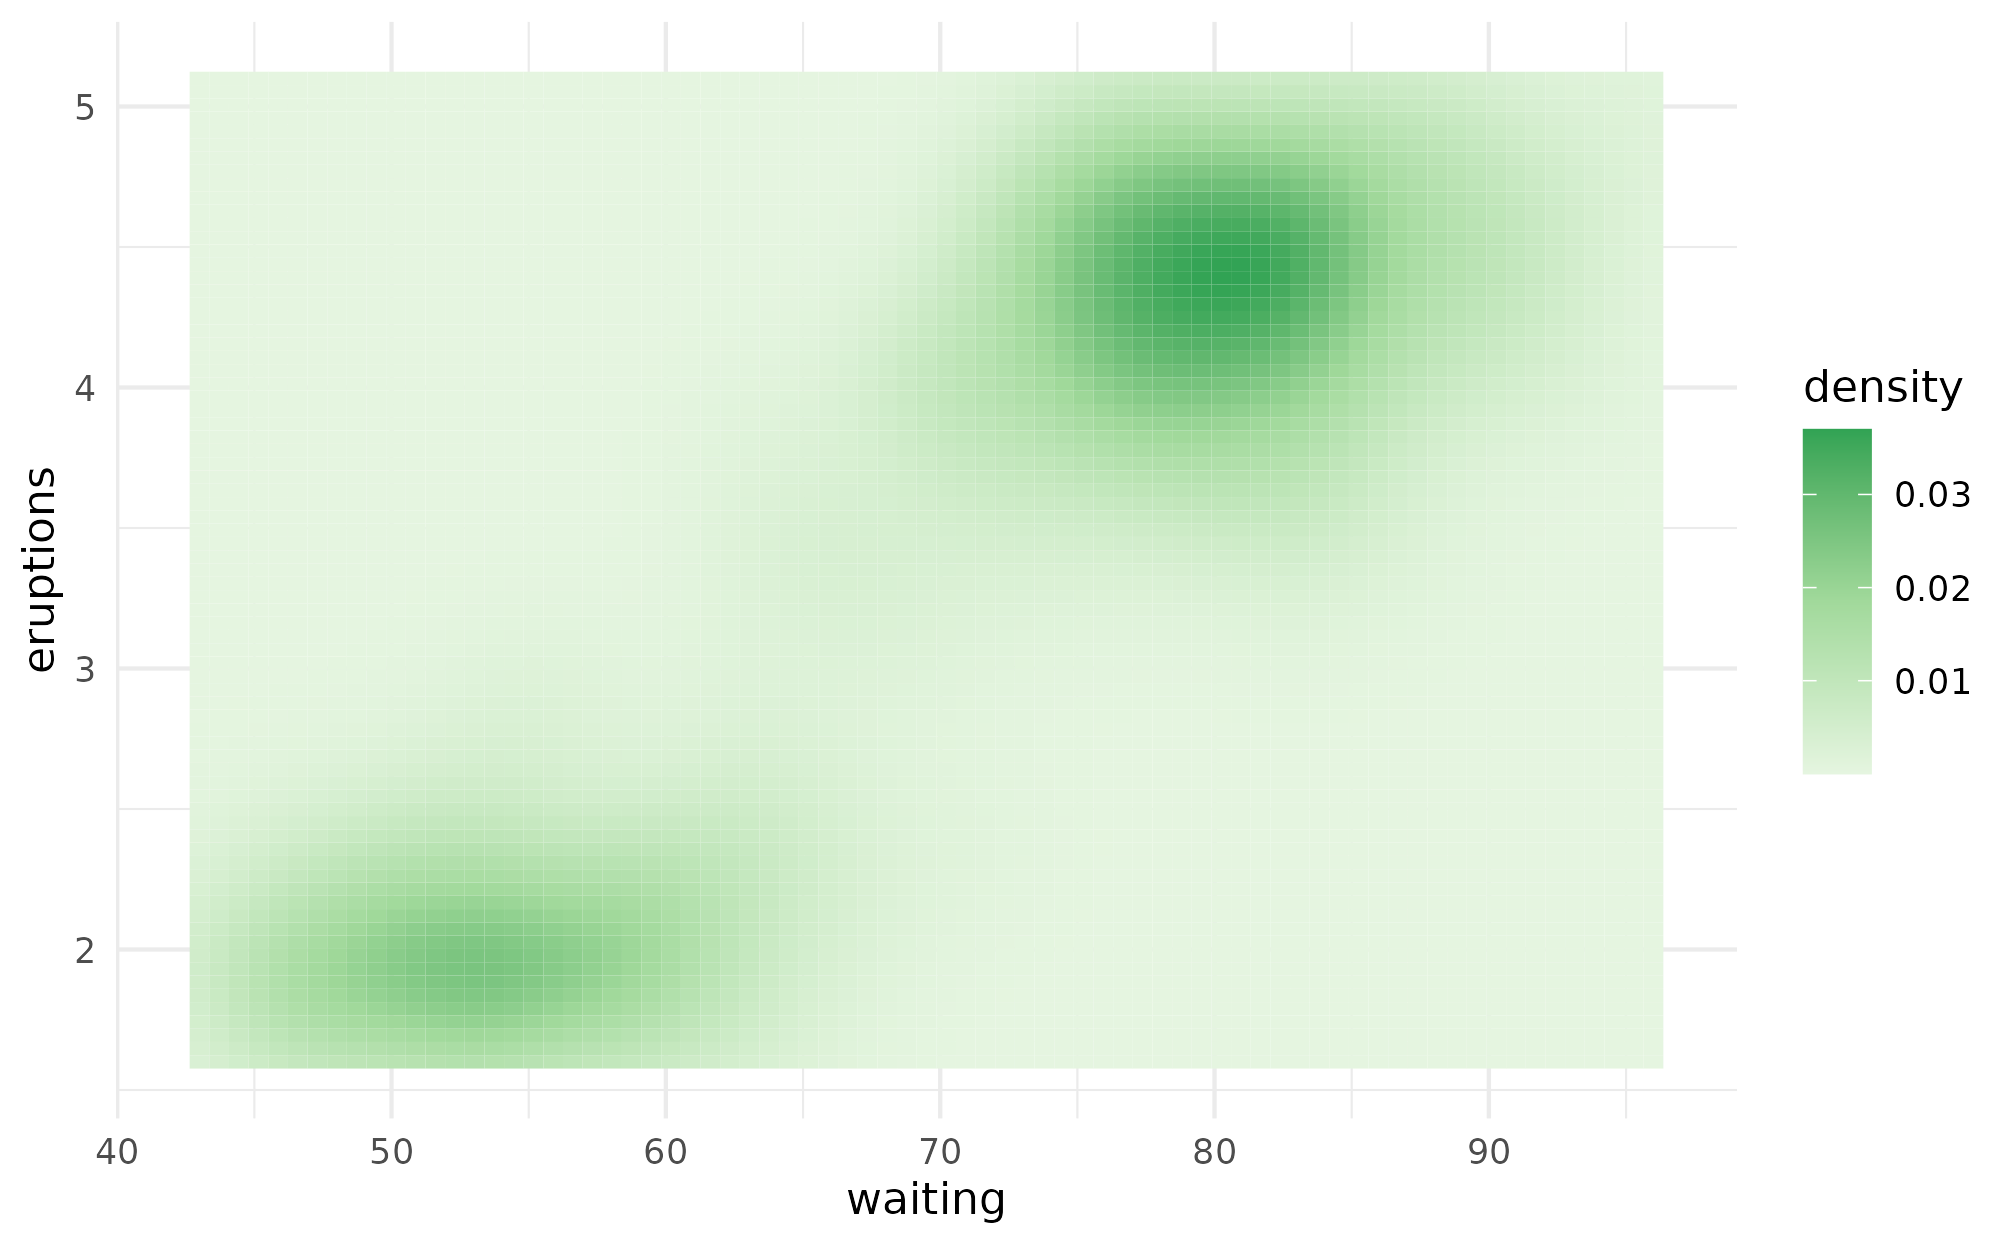
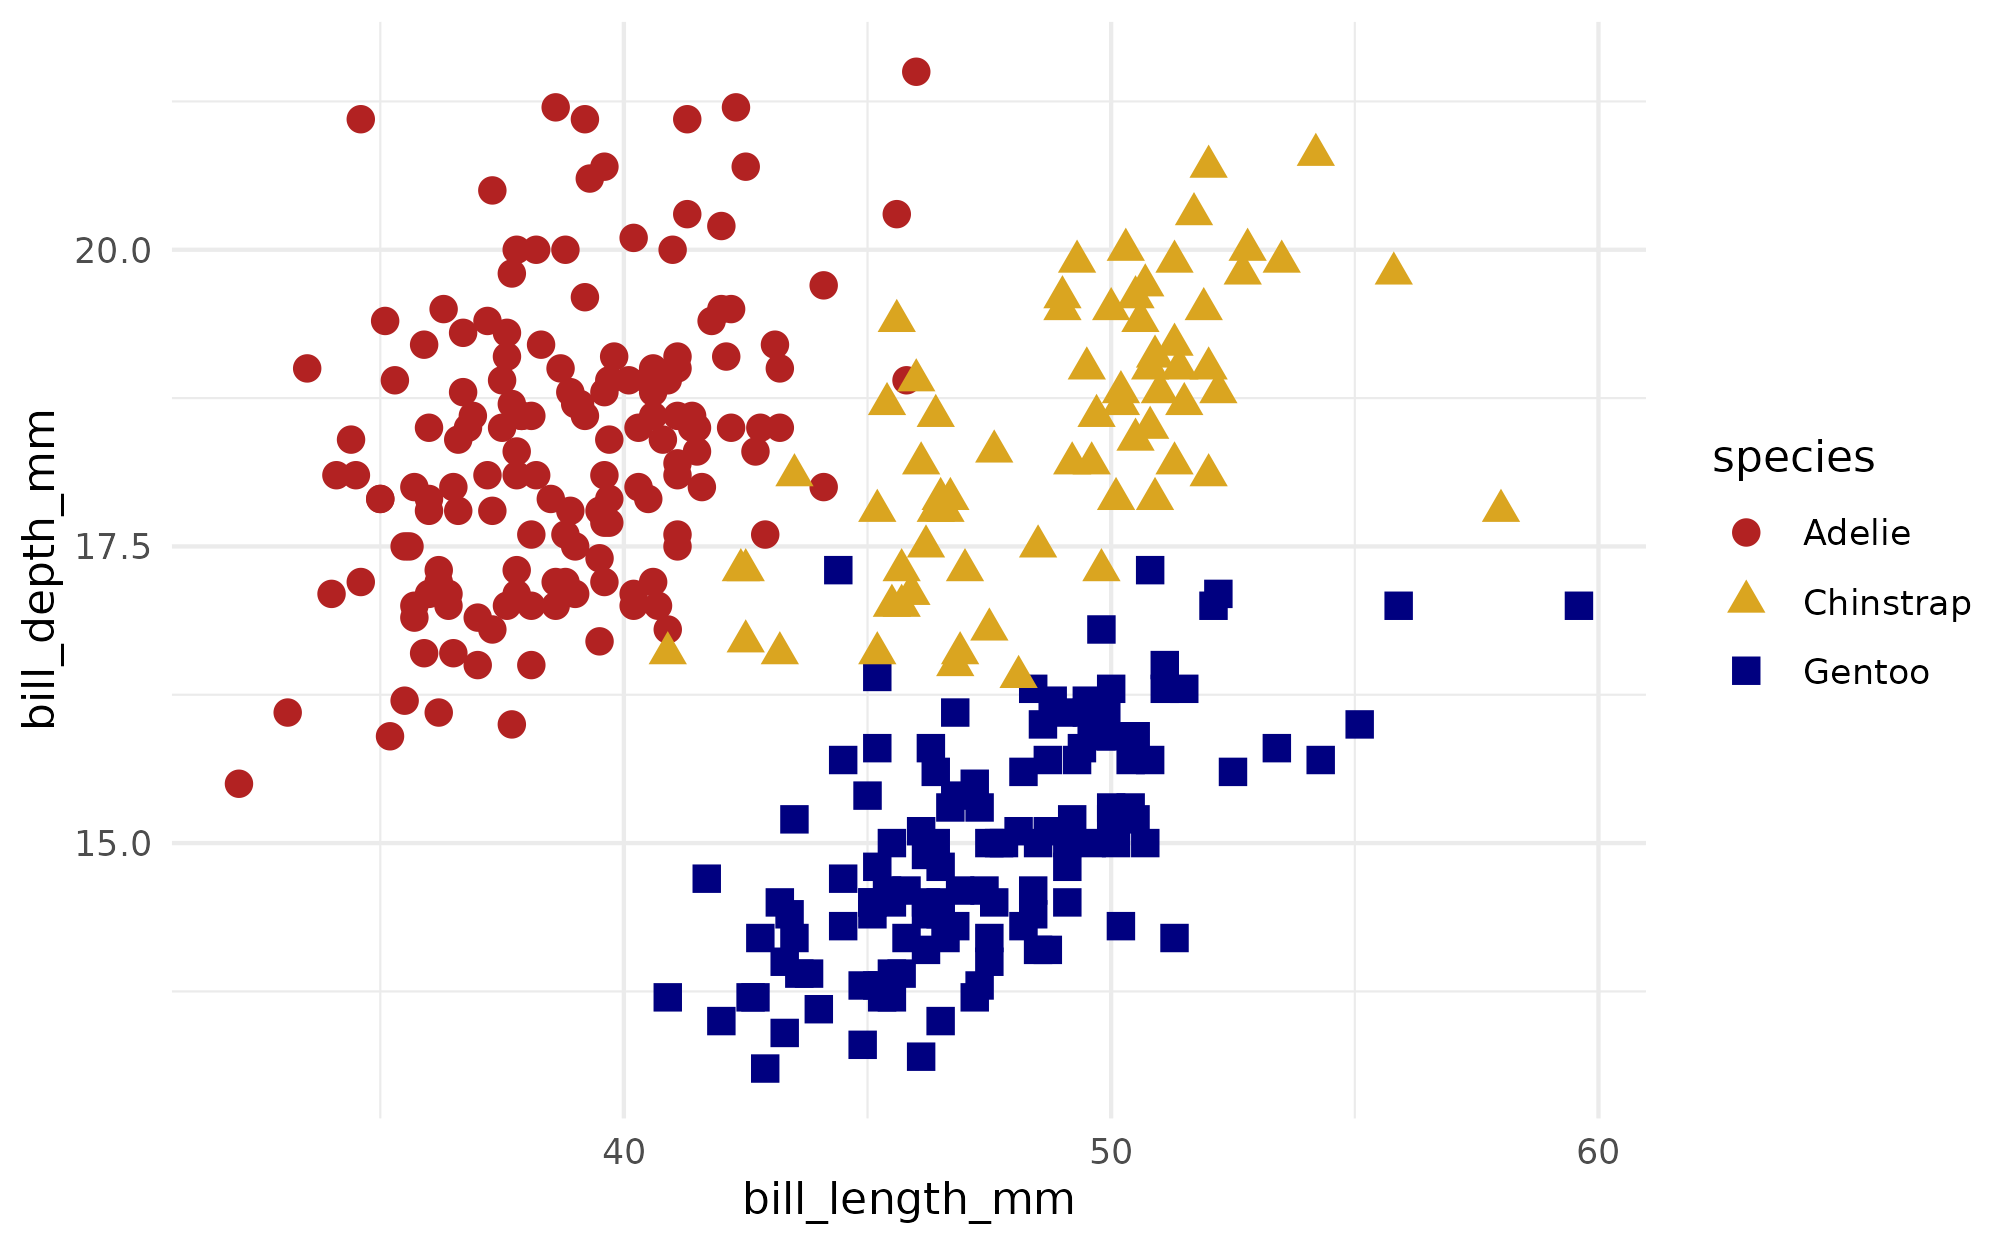
Finally, if we have a discrete scale, we can use
ggplot2::scale_fill_manual() or
ggplot2::scale_color_manual(). Here, we use the
?penguins data to map our palette to the species of
penguin.
penguin_pal <- color_palette(c(
  Adelie = "firebrick",
  Chinstrap = "goldenrod",
  Gentoo = "navy"
))
penguin_pal
#> <color_palette[3]>
#>     Adelie
#>     Chinstrap
#>     Gentoo

ggplot(penguins, aes(x = bill_len, y = bill_dep)) +
  geom_point(aes(shape = species, color = species), size = 3) +
  scale_color_manual(values = penguin_pal) +
  theme_minimal()